Descriptive part
General project description
In this project, we want to make a smart device, we want to get the data from a gas sensor and send them via the LORA protocol on the TTN site and then display the data from the sensor on a Dashboard on Node-Red. We are also interested in the energy consumption of the sensor, so we will use the sensor under a woken mode (very short time) to measure and send the data and another sleeping mode where it consumes almost nothing (during most of the time).
PCB Design

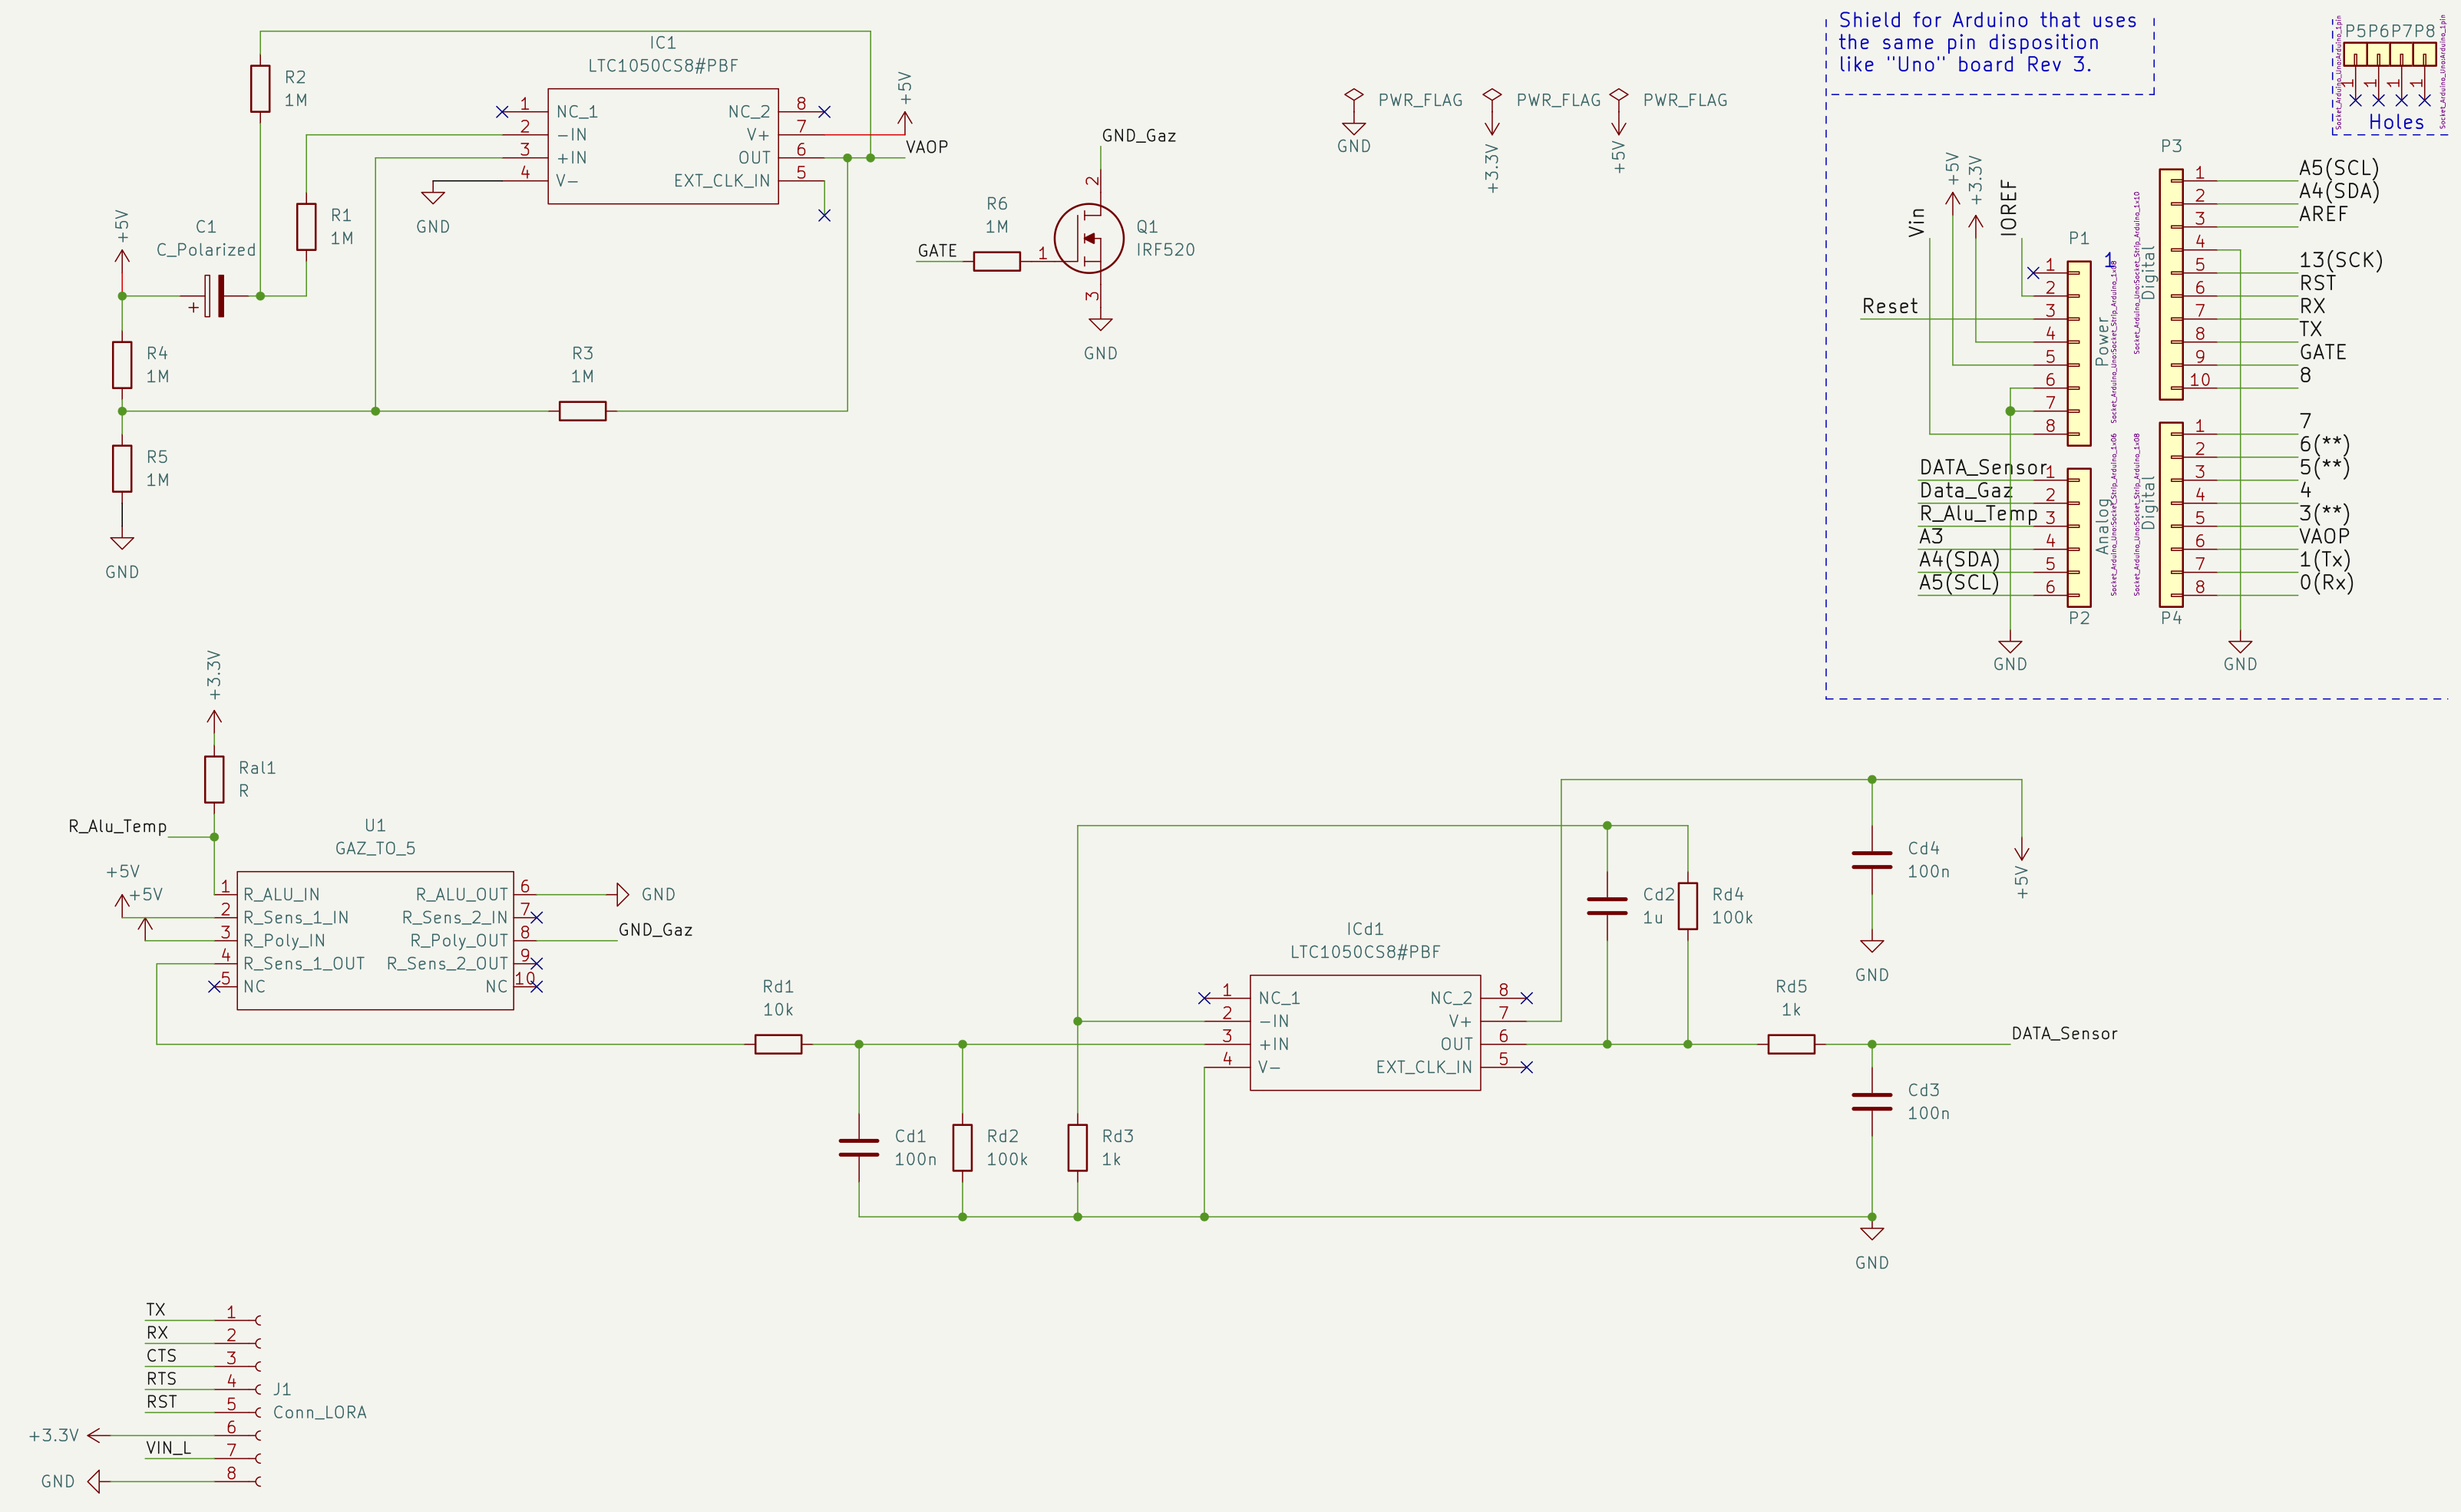
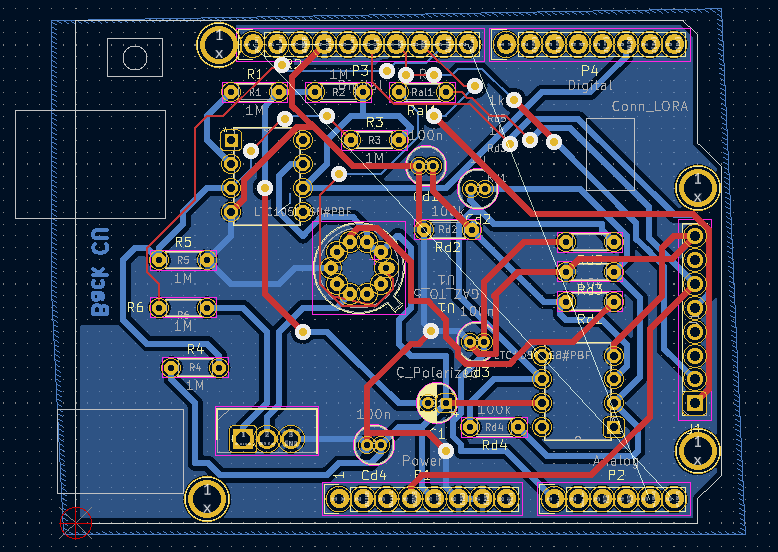
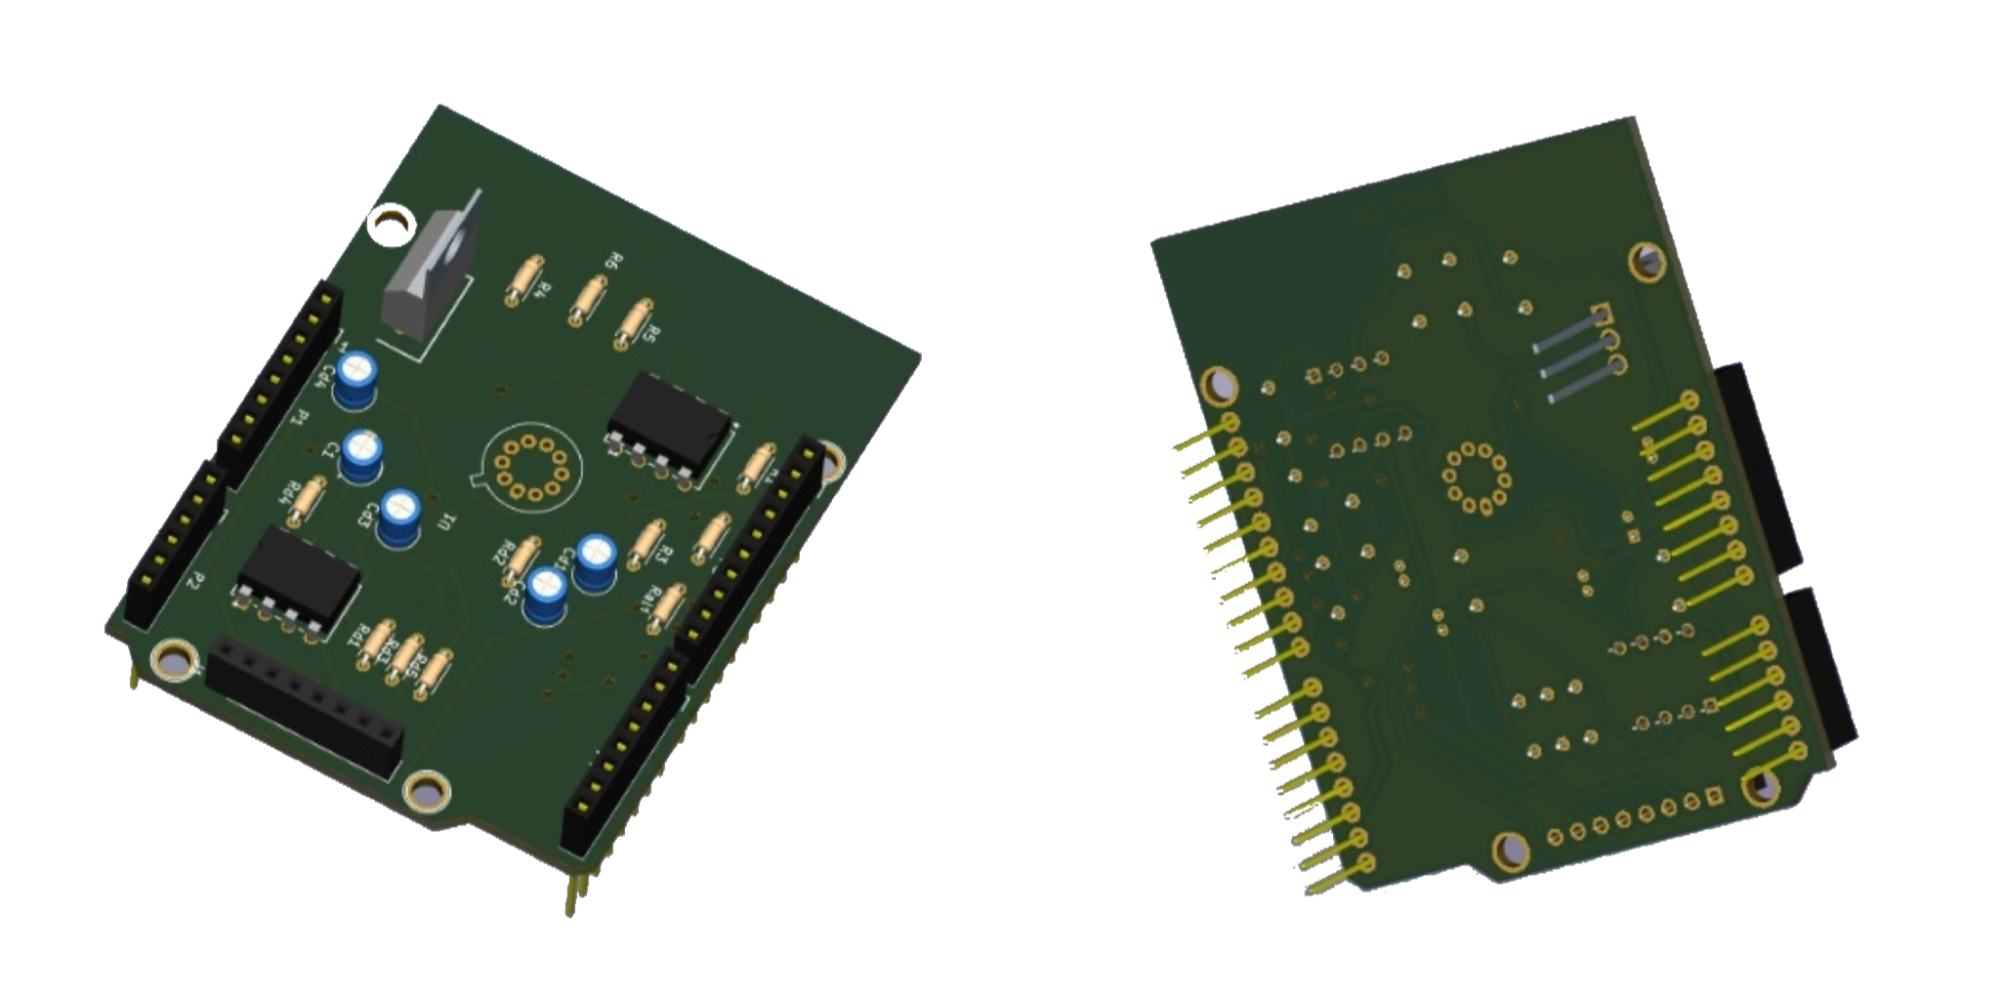
The Shield contains an impedance matching circuit to connect the gas sensor to the microcontroller (Arduino Uno) as well as an interrupt circuit which manages the two modes "Sleep" and "Wake-up" of the circuit and the gas sensor. A connector is provided to connect the circuit to the LORA antenna. The location of the gas sensor is in the middle of the PCB in the form of small circles.
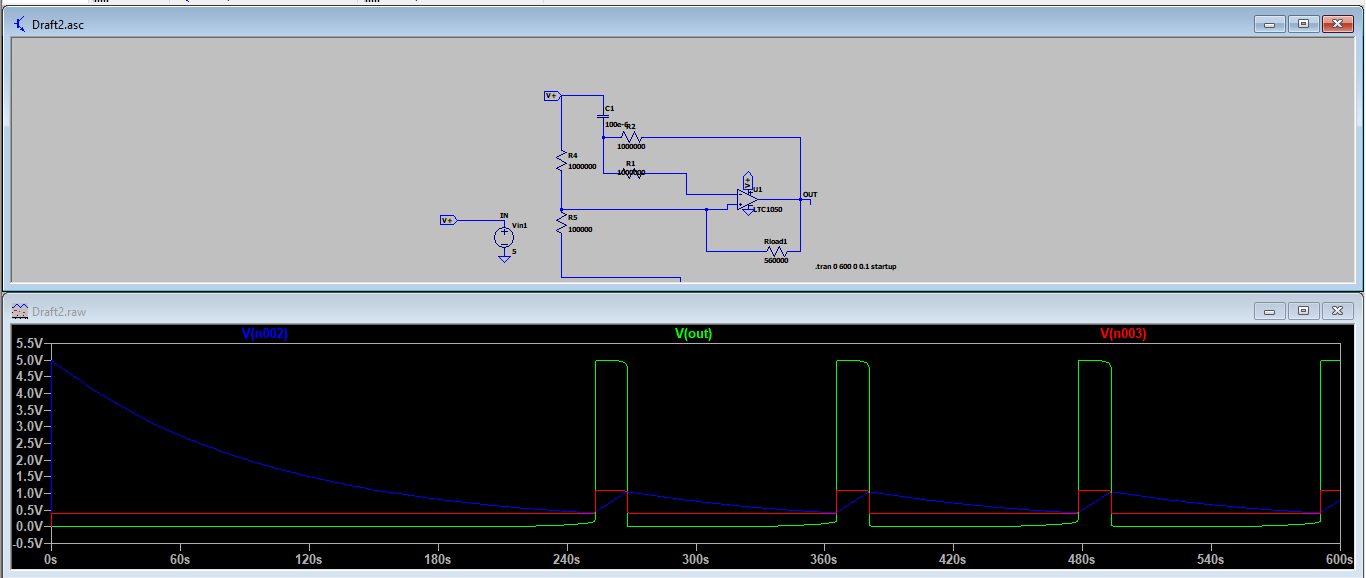
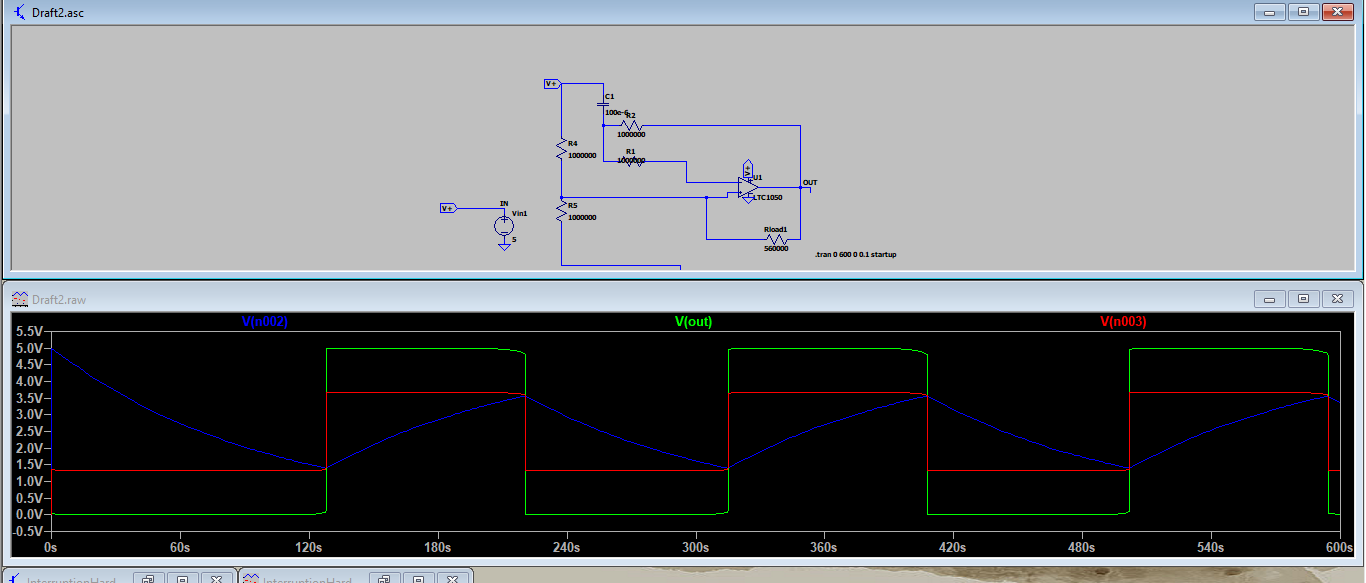
In order to simulate our interrupt circuit and manage the energy consumption of the circuit we used LT-SPICE to simulate the behavior we want. We notice on the two following figures that by varying the parameters of the various components of the circuit in particular the resistors, we manage to control the duration of interruption.
Lt-spice

Arduino

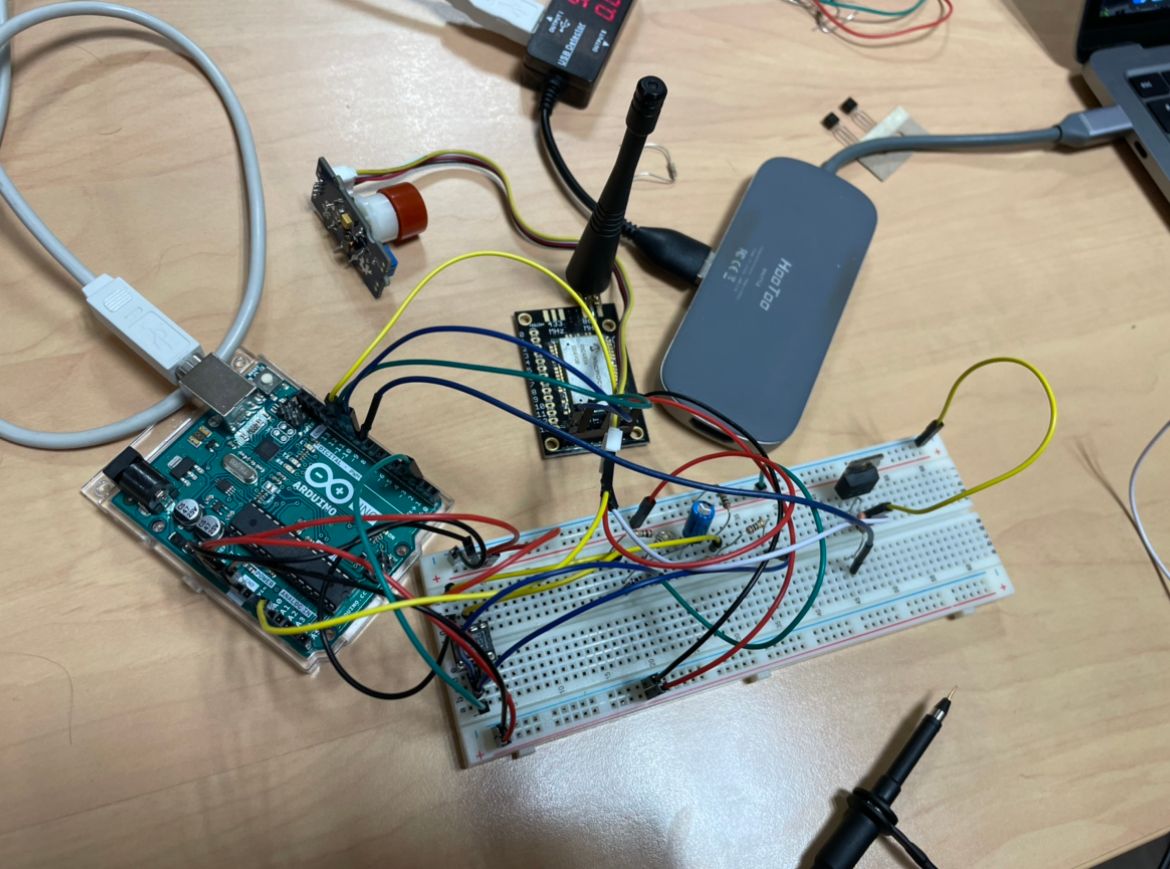
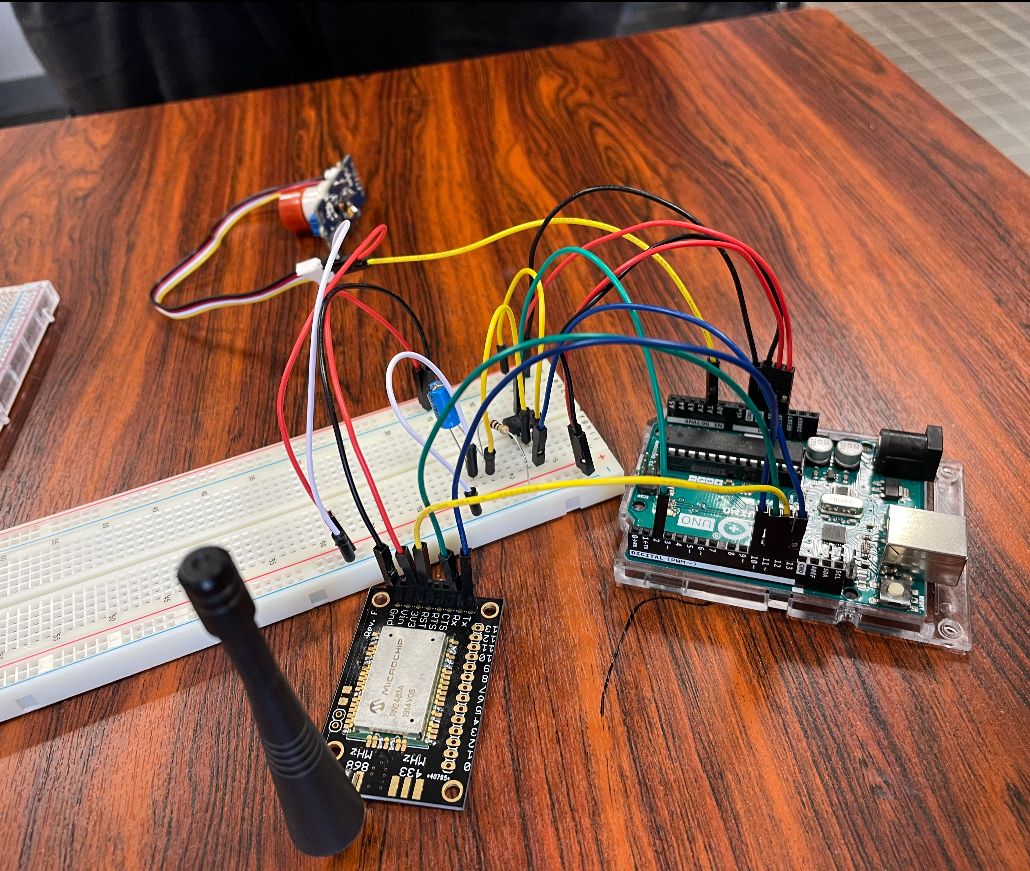
We use the Arduino UNO as a microcontroller with a breadboard to build the prototype circuit (interrupt circuit + groove gas sensor + LORA antenna). The Arduino code is composed of the following parts: acquisition of the sensor data and display on serial monitor, configuration of the TTN - LORA connection and management of the two Sleep and Wake-Up modes.
Energy consumption
With the aim of decreasing to the maximum the consumption of Energy of our system, we used a circuit of interruption, we even manage to switch off and to light again the sensor with this circuit by adding a transistor what reduces enormously the consumption of Energy of the circuit because it is the sensor which consumes the quasi-totality of the Energy consumed by the whole circuit.
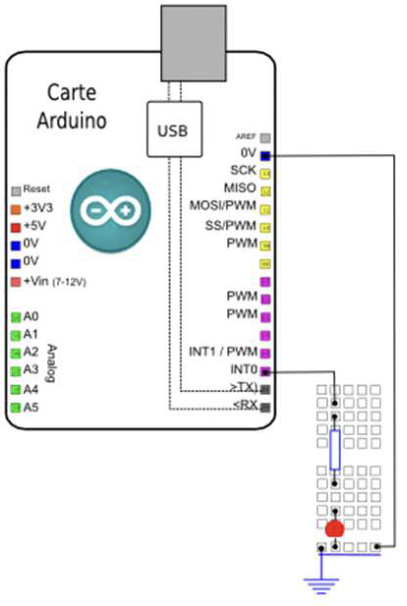
Thus, we have implemented two types of interrupts to optimize the power consumption of our circuit: a hardware and a software interrupt. Our hardware interrupt consists of an external cyclic trigger.
For this, we used an AOP to make a comparator, the circuit allows to generate square waves bases frequencies and to create an oscillator circuit allowing to vary the voltage between 0 and 5V in a cyclic way. It is possible to modify the frequency by changing the values of the capacitance or resistors. Indeed, if we increase for example the value of the capacity, the frequency will decrease and vice versa.
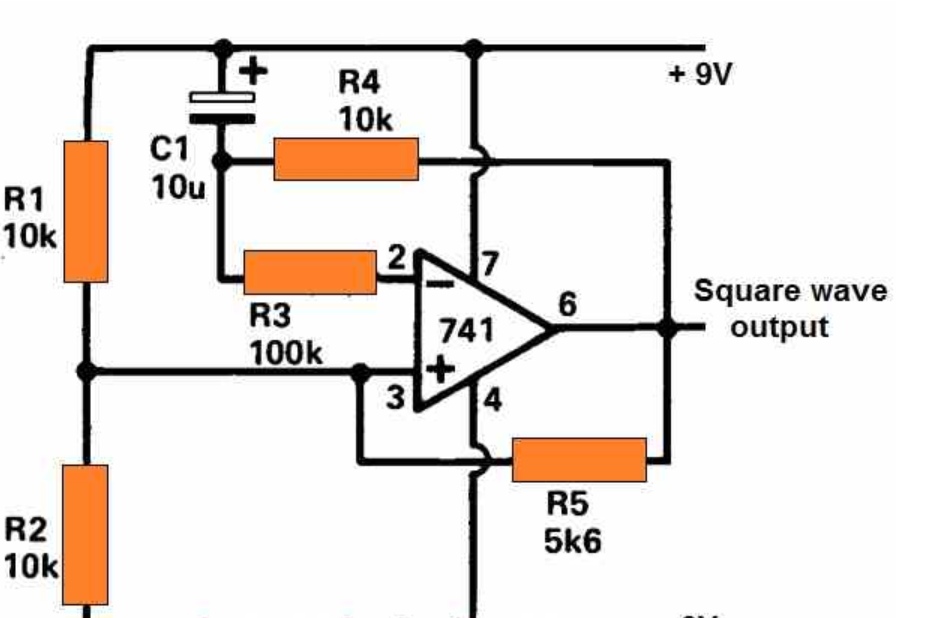
We simulated the circuit on LT-Spice for the choice of the values of the resistors and the capacity in order to obtain periods of activities and inactivities adapted to our application. The software interrupt is realized by the code present on the board. A software interrupt is performed when the circuit is in an inactive period to activate or deactivate the gas sensor.
Power consumption balance
We measured the current at the output of the circuit, for this we used a USB current sensor. It allows to measure the current consumed on a USB port in real time. We could then establish a table of measurements.
Thus, we have implemented two types of interrupts to optimize the power consumption of our circuit: a hardware and a software interrupt. Our hardware interrupt consists of an external cyclic trigger.
For that, we measured the current consumption of the circuit according to its behavior in wake-up mode (active), when the oscillation circuit imposes a voltage of 5V, in sleep mode, when the oscillation circuit imposes a voltage of 0V and the gas sensor is activated and in sleep mode, when the oscillation circuit imposes a voltage of 0V and the gas sensor is deactivated by software interruption.
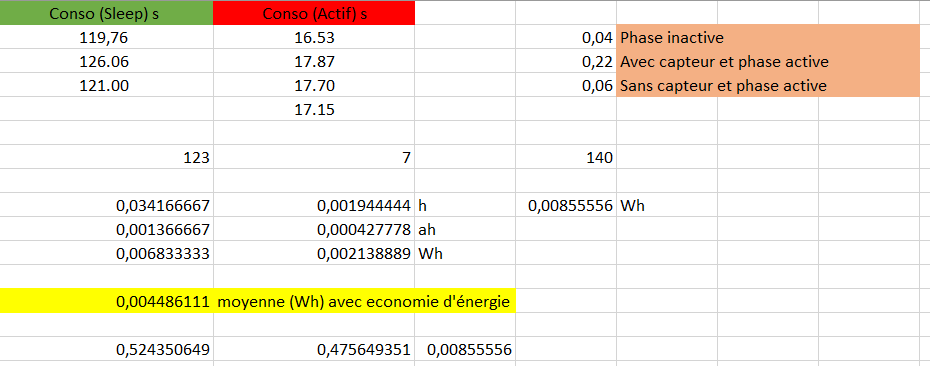
We can observe that it is the hardware interruption which has the most impact on the consumption, indeed, we pass from 0.22 to 0.04 A at the time of the periods of sleep imposed by the AOP comparator, that is to say a reduction of 0.18 A. While, the software interruption, it, allows a saving of 0.16 A by passing from 0.22 A to 0.06 A, this interruption makes it possible not to feed the sensor any more during the active phase, one can then notice that it is the gas sensor which consumes more in the circuit with a consumption corresponding to the 0.16 A of difference.
Moreover, we measured the duration of the periods of sleep and wake-up of the circuit, we observe an average period of 123 seconds for the inactive periods of the circuit against 17 seconds on average for the active phase, however, the software interruption activates the sensor only for a duration of 7 seconds.
The details of the calculations can be found in the readme on my GitHub repo.
Node-Red
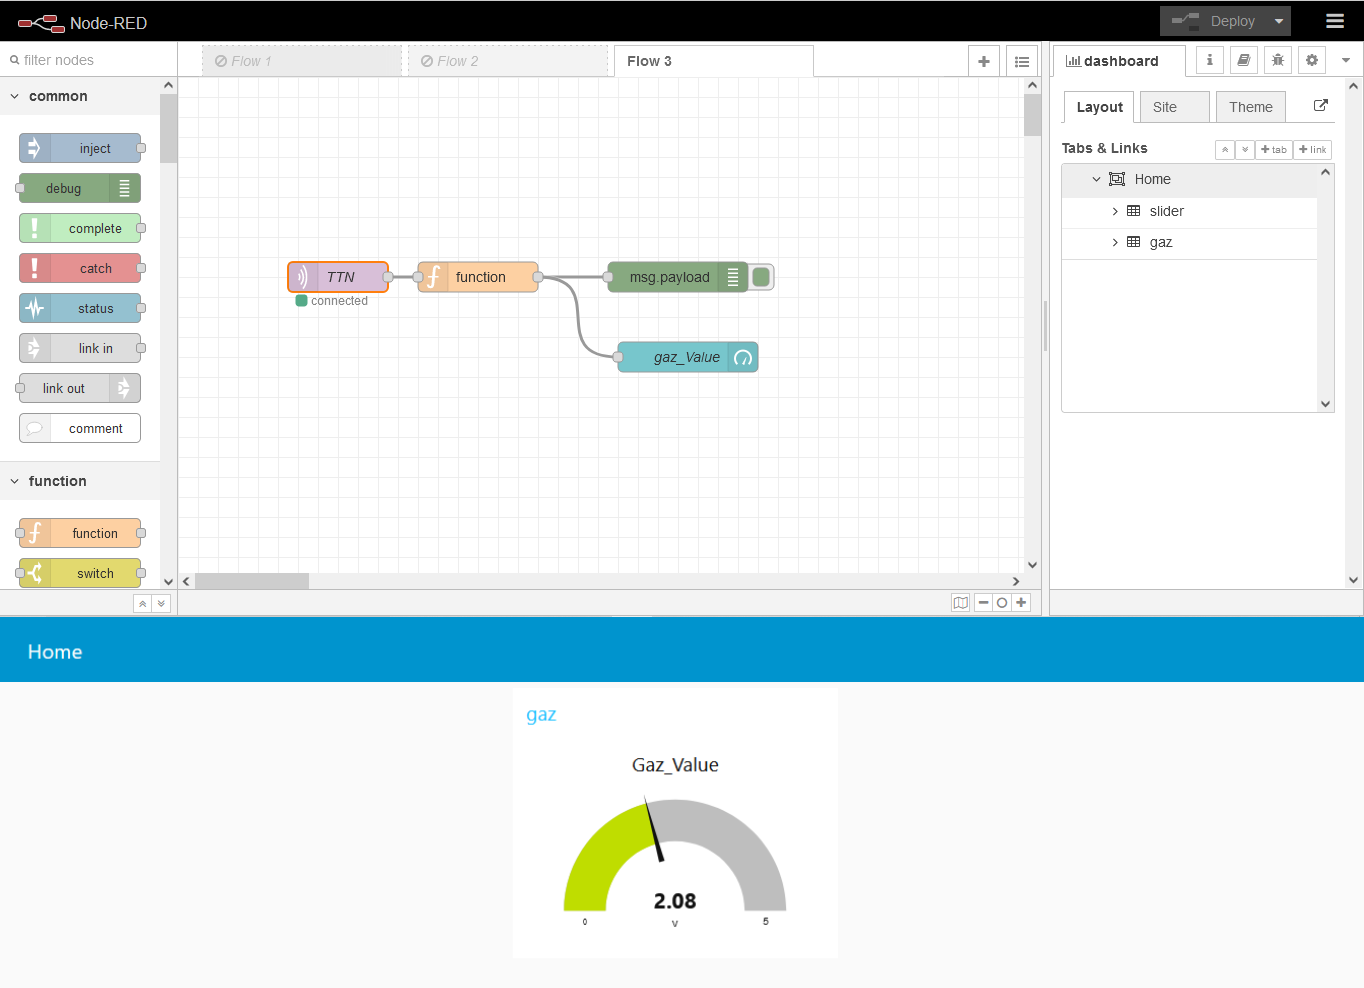
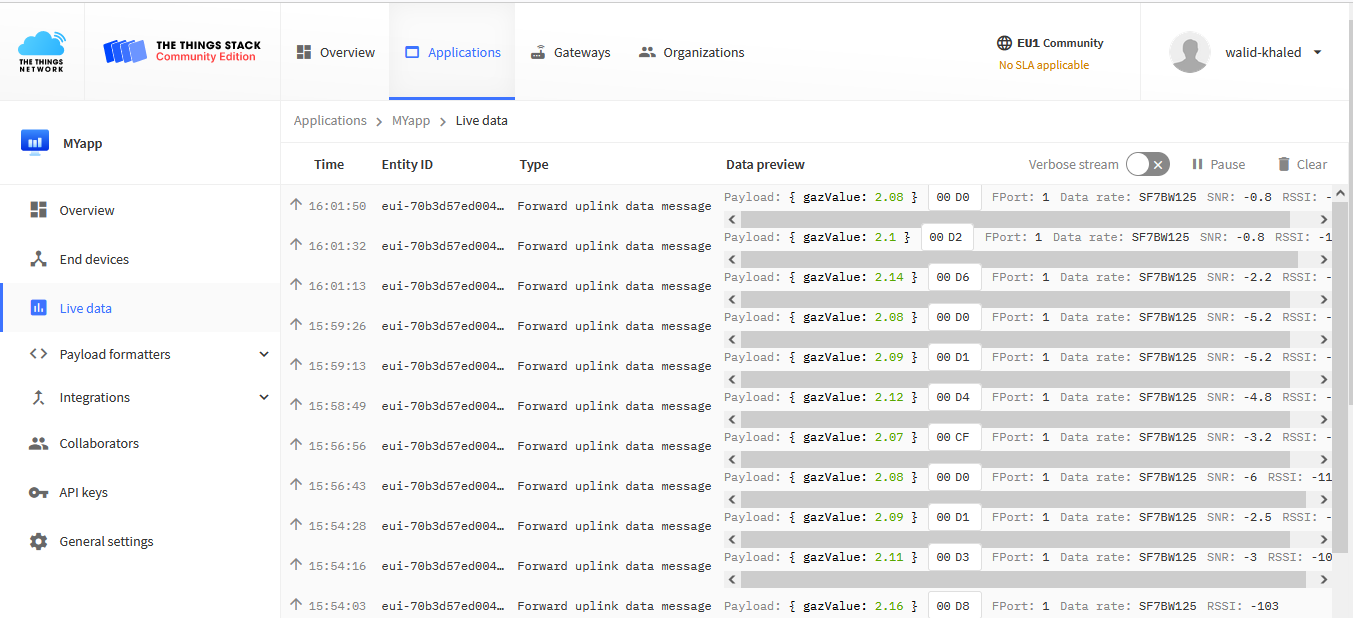
In order to display the data from our sensor, we use Node-Red, this is done by establishing a connection via the MQTT protocol between Node-Red and the TTN site. The flow is very simple for this application and allows to visualize in real time the value of the gas sensor.
